
A well-orchestrated start-up process can significantly accelerate the time to patient enrollment, reduce operational costs, and increase the likelihood of meeting study milestones.
Among the multitude of measurable metrics for a clinical trial, the cadence of site initiation (the rate at which sites progress from selection to being fully operational) proves to be a key variable that drives the pace of clinical trials. As companies set strategic objectives for trial activation, this metric should be at the forefront of conversations and goal-setting targets.
An ML-based stochastic gradient boosting model that leveraged 287 Phase III Oncology studies found that reducing the site initiation cadence by as little as 3 days could reduce overall trial timelines by about 20% or as much as 7-8 months.
Achieving such a reduction can be enabled by a feasibility and site identification process that considers not only historical site/investigator-specific enrollment rates, but also time to activation and ongoing competing trials to which they are committed. The path to rapid initiation requires meticulous planning, with precise focus on site identification and feasibility that begins as soon as, or perhaps even before, a protocol is conceptualised.
This article will examine systematic methods for measuring site activation efficiency, such as the number of sites initiated each month, as well as the intervals between these activations (site initiation rate). Monitoring the number of sites activated during a study provides information about the performance of parallel start-up processes and how quickly new sites become operational. Tracking the interval between activations enables companies to assess the impact of their start-up initiatives on activation timelines. Such metrics not only offer a window into operational performance but also highlight avenues for accelerating trial timelines and optimising resource allocation across clinical programs.
Model Methodology & Results
Predictive Analytics Illuminate Key Drivers
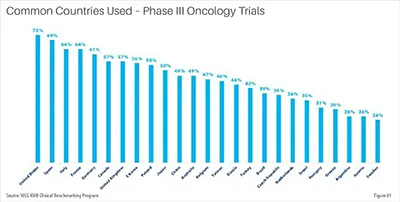
To analyse trends in site activation rates, a dataset of 287 Phase III Oncology studies that completed enrollment over the past five years was examined. On average, these studies involved approximately 15 countries worldwide. The chart below indicates the frequency with which each country participated in these trials.
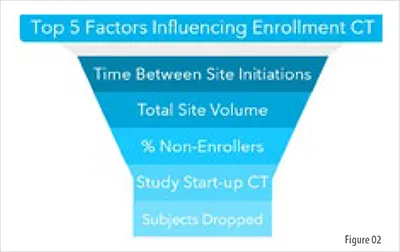
A machine-learning model was developed to predict enrollment cycle times based on site initiation metrics, trial characteristics, geography, and operational characteristics. The model employed was a stochastic gradient boosting model with a Cox proportional hazard loss function. The model included disease, line of treatment, disease rarity, number of endpoints, number of subject visits, start-up time, CRO involvement, number of patients, volume and geographic spread of the sites, non-enrolling site rate, and the average time between sites initiated over the course of the study. The resulting predictions were evaluated to identify the factors most associated with influencing enrollment cycle times. The following graphic presents the five factors associated with having an impact on enrollment cycle times in the dataset.
Site Activation as a Primary Driver
The Cadence of Initiation Determines Success
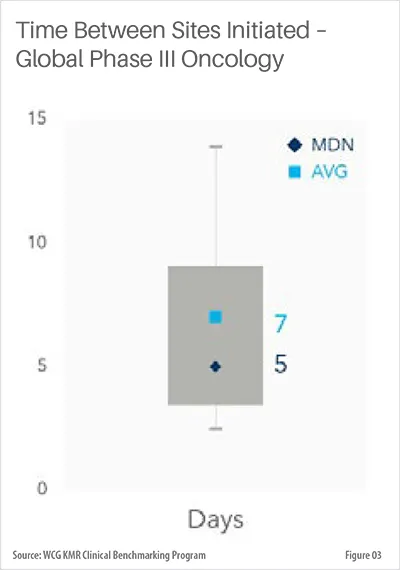
From the model results, the average interval between sites initiated stands out as a crucial determinant of enrollment duration. This cadence of site initiation proves to be a key variable that drives the pace of clinical trials.
Across all studies in the dataset, the median time between each site initiation was five days. The top quartile of trial performance is about three days apart.
This pace changes as the trial progresses. Time between sites starts out at six days, is fastest around months seven through nine (three days), and then slows for the remainder of the study.
To assess the direct effect of this metric on enrollment times, model inputs were subjected to random permutation before being evaluated by the model. Ridge regression models were subsequently employed to quantify the contribution of each feature within the model’s predictions. A forward selection approach identified up to 10 variables per trial that exerted the greatest influence on predicted outcomes, with each quantitative variable partitioned into eight quantile bins. The aggregated feature weights were then analyzed to determine which variables had the most significant, cumulative impact on enrollment duration.
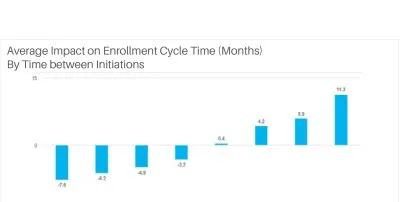
The graphic above presents the average predicted effect on enrollment time at eight quantiles of feature impact, based on the complete dataset of trials in the model. This analysis isolates the impact of the average gap in site initiation dates, with other variables held constant. In doing so, we aim to quantify the magnitude of reducing site initiation intervals.
The chart illustrates the average effect on predicted cycle time corresponding to various mean intervals between sites initiated throughout the trial period. The x-axis represents evenly distributed quantiles for the average duration between site initiations, while the bars depict the anticipated impact on enrollment cycle time, assuming all other variables remain constant for each specific site initiation rate. For example, an average initiation of 2.2 days is associated with a reduction of 7.6 months in enrollment cycle time, compared to an average initiation rate of around five days. Overall, an average site initiation interval below five days between sites is associated with a decrease in enrollment cycle time for Phase III Oncology trials.
Setting Site Initiation Goals
Benchmarking Performance and Driving Accountability
To improve initiation timelines, organisations should establish ambitious site activation objectives and ensure team accountability for meeting these targets. A practical approach is to set monthly benchmarks for the number of sites launched throughout the duration of the trial. By leveraging benchmarking data and predictive analytics, companies can evaluate prevailing industry trends and assess the top quartile performance.
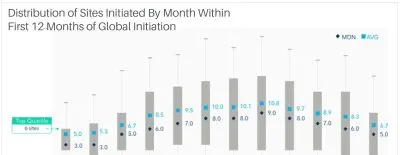
The chart below illustrates the pattern of site initiations during the initial 12 months of a clinical trial. Given that these studies span an average of fifteen countries, the initiation numbers naturally increase as more regions commence their startup processes. This global scope underscores the importance of coordinated site activation strategies, revealing how synchronised efforts across diverse locations can expedite trial progress and enhance overall efficiency. The median number of sites initiated in the first month of a study is three, though the top quartile is a minimum of six sites, with some studies able to achieve more.
By analysing these site initiation gaps within countries, as well as identifying the “best performer” initiation rate, we can identify significant opportunities to compress trial timelines. The space between site initiations represents an opportunity for efficiency gains. By reducing these gaps, sponsors and CROs can enhance the overall momentum of the study.
Considerations for Streamlining Site Activation
Overcoming Hurdles from Site Selection to Contracting
Several critical processes can contribute to delays in site activation. Prior to selecting sites, it is necessary to identify those suitable for potential participation in the clinical trial. Optimising site identification based on well-defined study criteria is crucial for an effective selection process. Relying solely on established site relationships, traditionally common, has proven to be inefficient and may incur significant resource and time costs. In today's environment, where advanced analytics and technology are readily available, organisations should leverage both historical site experience and comprehensive performance data. Incorporating supplementary data sources, such as claims and electronic health record (EHR) data, can further enhance the development of optimised site lists.
During the site selection process, it is essential to evaluate sites for their compatibility and willingness to participate in the clinical study. The feasibility assessment can present challenges for all parties involved; however, leveraging a platform with established site capabilities and capacities can streamline this process and facilitate the efficient achievement of site selection objectives. Working with site networks or preferred partners can be effective, given that key site attributes are well known to the sponsor, and alignment to a study can be made quickly. In cases where a potential study faces a competitive market, sponsors may need to approach research-naïve sites, which can pose further challenges in training and the setup of site resources.
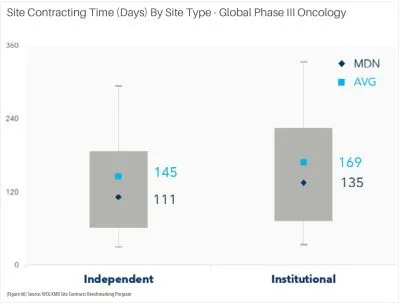
Following site selection, several key activities occur before site initiation, including IRB review, IBC approval, coverage analysis, budgeting, and contract negotiation. Among these steps, budget development and contract execution constitute the most time-intensive components of the process. The graph below illustrates current contract timelines in the United States by site type for Oncology in Phase III. Institutional sites require approximately 135 days to finalise contracts, whereas independent sites average around 111 days.
An integrated process of site activation activities can prove to be beneficial in reducing activation timelines. Given the unique needs of each site, companies should strive to align their processes and identify a tailored solution.
Conclusion
Accelerating Clinical Trials Through Strategic Site Activation
The efficiency of site activation stands as a pivotal determinant of clinical trial success, influencing the overall timeline, resource allocation, and ultimate outcomes in drug development. By focusing on streamlining site selection, expediting contracting, and adopting data-driven approaches to activation cadence, organisations can reduce white space, significantly decrease enrollment cycle times, and bring breakthrough therapies to patients more swiftly. As the clinical research landscape grows increasingly complex, those who prioritise and innovate in the site start-up phase will be best positioned to achieve operational excellence and competitive advantage.